
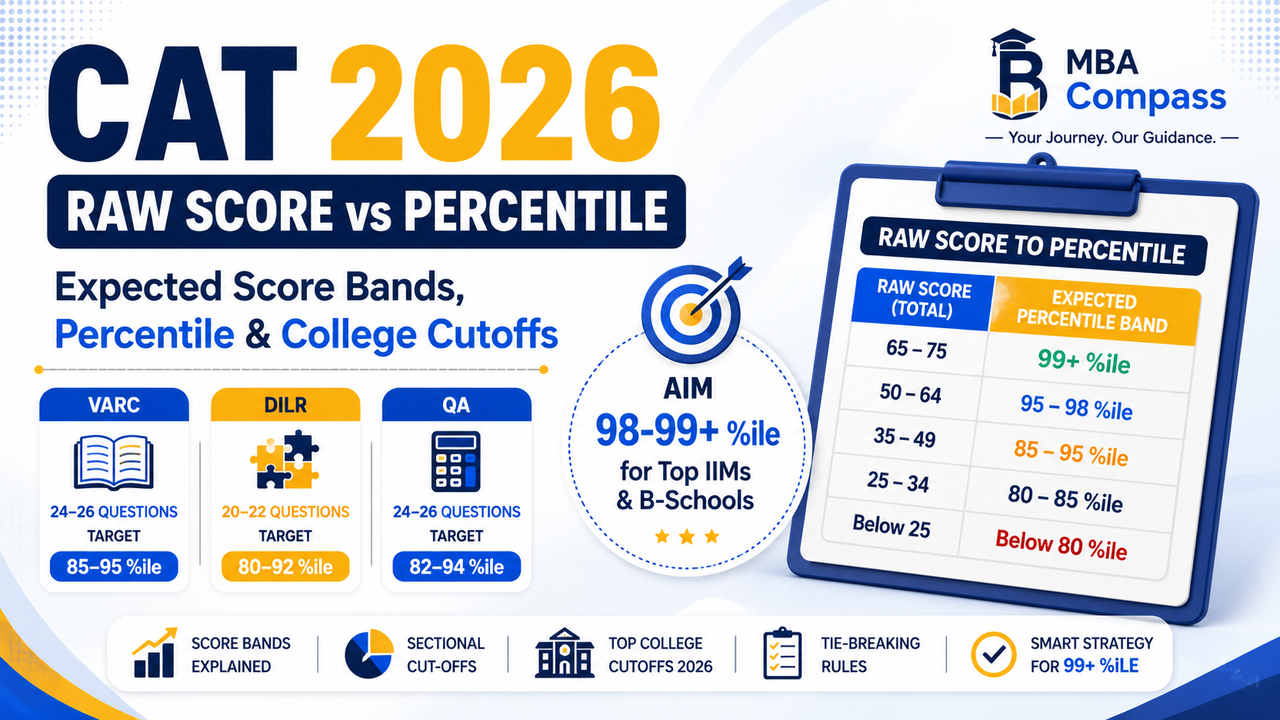
A raw CAT score translates to a percentile based on relative performance in each slot; expect rough 2026 bands where 99+ %ile maps to about 65–75 raw marks, 95–98 %ile to 50–64, and 85–95 %ile to 35–49 depending on slot difficulty.
Brief context: These are expected 2026 score bands and will vary by slot, section difficulty, and candidature mix; CAT remains the primary exam for IIM shortlisting but XAT, NMAT, SNAP, and CMAT also matter for non-IIM colleges.
Quick bullets
99+ %ile expected raw band: 65–75 marks (slot-dependent).
95–98 %ile expected raw band: 50–64 marks.
85–95 %ile expected raw band: 35–49 marks.
Sectional cutoff typical band: VARC 85–95 %ile, DILR 80–92 %ile, QA 82–94 %ile for top IIMs (expected 2026).
Top college cutoffs expected bands: IIM-A 98–100 %ile, IIM-B 97–99.5 %ile, XLRI (XAT) 96–99 %ile, FMS Delhi 98–99.5 %ile (verify with official notices).
Batch size range typical: 300–520 seats for each IIM PGP; FMS ~300; XLRI 300–350 (2026 batch estimates).
Tie-break rules common: sectional accuracy, higher VARC/DILR priority, older candidate tie-breakers; confirm with official CAT 2026 instructions.
Exam window CAT 2026 date: official date (registration likely Oct-Nov 2026 window).
Entity | Expected %ile band 2026 | Expected raw score band | Notes | Source / action |
|---|---|---|---|---|
IIM Ahmedabad | 98–100 %ile | ~65–75 | High sectional cutoffs; GD-PI-WAT rounds | According to official admission data |
IIM Bangalore | 97–99.5 %ile | ~60–72 | Strong weight to work-ex and academics | Based on past shortlists |
98–99.5 %ile | ~66–74 | Small batch, high competition | Verify with official FMS notice | |
85–97 %ile | 35–64 | Depends on programme and category | Check college-specific cutoffs |
Immediate next steps:
Estimate your raw — convert a mock raw score to expected %ile using mocks and slot difficulty.
Check sectionals — target VARC/DILR/QA bands above listed sectional cutoffs for your target colleges.
Shortlist colleges — use a mix of reach, target, safe IIM and non-IIM options.
Verify notices — watch official CAT/XAT bulletins and college admission pages for 2026 updates.
Prepare PI/WAT — shortlist conversion depends on GD-PI-WAT performance and work-ex.
Mentor tip: Want expert guidance for MBA admissions? Connect with our mentors today. Use the Profile Analyzer to map score-to-shortlist and try the College Shortlister to build a balanced list.
How CAT Raw Score Converts to Percentile
Direct answer: CAT raw marks are converted to percentiles by section-wise normalization and overall scaling across test slots; the process produces an equi-percentile score distribution so candidates in different slots are comparable.
Summary: This section explains sectional equi-percentile scaling, tie-breaking rules, and a simple method to estimate your percentile from raw marks. It uses 2026 admission context and mentions IIMs, XLRI, FMS, MDI, SPJIMR, NMIMS where shortlisting matters.
Here's the thing — CAT is delivered in multiple slots, so raw marks alone don't tell the story. The exam authority converts raw marks to scaled scores per section, then combines them into a scaled total. Sectional equi-percentile scaling matches percentile ranks across slots so that a scaled 80 %ile in Slot 1 equals a scaled 80 %ile in Slot 3.
How scaling, tie-breaks and normalization work
Step 1 — Normalization: For each section (VARC, DILR, QA) raw scores are converted into scaled scores using equi-percentile method across all slots; this reduces slot bias. Based on CAT 2026 test structure, expect sectional max raw to be 34-40 marks depending on official pattern.
Step 2 — Aggregation: Scaled sectional scores are summed to give an overall scaled score. Admission committees at IIMs and other top colleges then convert the scaled score to a percentile band for shortlisting; expected overall percentiles use bands like 99.5-100 %ile, 95-99 %ile, 90-95 %ile.
Raw score band (total) | Expected percentile band | Typical college shortlist range | Notes |
|---|---|---|---|
65-75 | 99.5-100 %ile | IIM-A/IIM-B/IIM-C/IIM-L/Writers | Top 7 IIMs shortlisting band; verify with official year data |
55-64 | 98-99.5 %ile | IIM-K/IIM-I/XLRI/FMS | Often converts to shortlist invites at Tier-1 colleges |
45-54 | 95-98 %ile | MDI/SPJIMR/NMIMS/IIFT | Good chance at top private and some IIMs' newer programmes |
35-44 | 90-95 %ile | IMT/IMI/Some NMAT snaps | Competitive for top regional colleges and internal categories |
25-34 | 80-90 %ile | Many private B-schools, state colleges | Work-ex and SOP can influence shortlists heavily |
0-24 | Below 80 %ile | Target B-schools, MOM/part-time | Consider NMAT/MAT/CMAT as alternate paths |
Practical steps to estimate your percentile from raw marks:
Find section raw — record raw marks in VARC, DILR, QA immediately after the test or from your test report.
Use equi-percentile — convert each section raw to percentile using slot-wise conversion charts released by IIM (official data expect section max ~40).
Sum scaled scores — add scaled section scores to get overall scaled total and map to percentile bands like the table above.
Adjust for tie-break — if two candidates have same scaled score, institutes use sectional percentiles, then total accuracy, then older candidate rule for final ranking.
Cross-check with 2026 reports — compare with placement/shortlist trends from IIMs, XLRI, FMS; based on placement reports, shortlist thresholds still cluster above 95 %ile for top seats.
Worked examples:
Riya: CSE grad with VARC 14, DILR 18, QA 22 → raw total
- Expected overall 98-99 %ile; good shot at IIM-K and XLRI shortlist.
Aman: 4-yr IT professional with VARC 10, DILR 12, QA 18 → raw total
- Expected 92-95 %ile; shortlist chances at MDI, SPJIMR, NMIMS depending on profile.
Sneha: fresher commerce grad with VARC 8, DILR 10, QA 12 → raw total
- Expected 85-90 %ile; focus alternate exams like NMAT or CMAT and strengthen SOP.
Quick reality check: these bands are expected ranges for 2026-27 admissions; official slot Normalization charts and final percentiles will be published by CAT conducting IIMs and must be verified with the official scorecard.
College Shortlist Impact — Cutoffs and Shortlisting
Direct answer: Colleges shortlist using overall CAT percentile plus sectional %ile cutoffs and your profile (work-ex, academics, diversity). If you miss a sectional cutoff, you’re usually out even with a high overall percentile; if you hit sectionals but your profile is weak, you fall into waitlist zones.
Shortlist mechanics: Most top schools — IIMs, XLRI, FMS, MDI, NMIMS, IIFT — apply an initial overall %ile screen and then enforce sectional cutoffs in VARC, DILR and QA (or equivalent). Interview invites are weighted by profile points: work-ex, academic band, female/diversity, and past calls. Based on admission committees' trends in 2026-27, interview pools have shrunk by an estimated 10-15% at top IIMs compared with 2024.
Expected cutoff bands and decision rules
College | Expected overall %ile (2026) | Expected sectional %ile | Profile weight | Action rule |
|---|---|---|---|---|
98.5-99.9 %ile | 95-98 %ile across sections (XAT pattern) | High (GD-PI weight + work-ex) | Aim for retake if below 95 %ile; apply only if profile 2+ yrs exp | |
99.0-99.9 %ile | 96-99 %ile sectional bands | High (academics + work-ex) | Retake unless you have a strong profile or an exceptional SOP | |
IIM-Bangalore | 98.8-99.9 %ile | 95-98 %ile | High | Consider apply if profile strong; otherwise prepare for retake |
98-99.5 %ile | 90-96 %ile | Medium (fees-sensitive selection) | Apply even at 98 %ile if you have strong academics | |
97.5-99 %ile | 90-95 %ile | Medium | Good target if overall > 97.5 %ile; apply to backup NIT + private | |
95-98.5 %ile | 88-94 %ile | Medium | Apply broadly; good shot at 96 %ile | |
96-99 %ile | 90-96 %ile | Medium | Apply if overall > 96 %ile or strong profile |
Decision rules:
Below sectional cutoffs: If any section <90 %ile, favour a retake unless you have >2 years strong work-ex.
Overall high but weak profile: If overall > 98.5 %ile but academics <60% and zero work-ex, apply selectively to FMS/MDI/NMIMS and strengthen essays.
Borderline overall (95-98 %ile): Apply to a mix of target (NMIMS, IIFT) and safe private colleges; use profile points to push invites.
Strong profile with moderate %ile: 3+ years work-ex or leadership roles can compensate for a 95-96 %ile at some IIMs—only in rare shortlisted pools.
Backup planning: Always pick 3 backup colleges with expected overall cutoffs 5-7 %ile lower than your current score band.
Context: Based on placement reports and official admission data from institutes and industry expert commentary during 2026-27, shortlists tightened and profile scores gained weight.
Need help? Need help selecting the right MBA college? Explore our College Shortlister and run numbers in the MBA ROI Calculator to prioritise applications.
Comparison Tables: Score–Percentile and Cutoff Matrix
Direct answer: A CAT raw score maps to a percentile non-linearly; small raw-score gaps near the top change percentile a lot, while mid-band scores move percentiles slowly. Use the tables below to estimate where your CAT score vs percentile sits and which colleges you can realistically target.
Context: Based on placement reports and recent admission trends for 2026-27, IIM calls and top colleges tightened shortlists; expected cutoff bands below reflect that tightening and should be verified with official notices.
How to use these tables: Match your raw score in Table 1 to get an approximate percentile, then check Table 2 for college cutoff bands and Table 3 for sectional expectations; if you're within the 95-99 %ile, target IIMs and XLRI for shortlist calls.
Score–Percentile, College Cutoffs, and Sectional Bands
Raw Score (out of 198) | Approx %ile (2026) | Category Notes | Decision Rule |
|---|---|---|---|
160+ | 99.5-100 %ile | Top-10 IIMs pool | Apply to IIM-A/B/C, XLRI, FMS interview shortlist likely |
140-159 | 97-99.4 %ile | Strong for IIM-B/C/E/F, XLRI | Expect sectional cutoffs; target super-selective colleges |
120-139 | 92-96 %ile | Good for IIMs beyond top-6, NMIMS, SPJIMR | Boost VARC/DILR to clear sectional thresholds |
100-119 | 85-91 %ile | Target Tier-2 colleges: MDI, IIFT shortlists for some profiles | Work on QA to push sectional percentiles |
80-99 | 70-84 %ile | Shortlist for regional colleges, NMAT optional | Consider retake or apply to NMIMS, SNAP |
0-79 | 0-69 %ile | Low shortlisting probability | Plan a repeat or target MBA colleges with lower cutoffs |
College | NIRF Band 2026 | Fee Range (INR lakh) | Expected Avg CTC (INR LPA) | Expected Overall Cutoff %ile | Top Recruiters |
|---|---|---|---|---|---|
11-20 | 18-24 | 14-22 | 98-100 %ile | Accenture, HUL, ABG, McKinsey | |
151-200 | 2.5-5 | 4-8 | 60-75 %ile | Local consulting, BFSI, IT services | |
101-150 | 3-6 | 5-9 | 65-78 %ile | IT services, regional recruiters | |
FMS Delhi | 11-20 | 0.5-1.5 | 14-20 | 99-100 %ile | Tata, Goldman Sachs, BCG |
MDI Gurgaon | 31-50 | 17-22 | 12-18 | 97-99 %ile | McKinsey, Accenture, HUL |
SPJIMR Mumbai | 21-30 | 18-23 | 11-17 | 96-99 %ile | Reliance, Deloitte, ITC |
NMIMS Mumbai | 41-60 | 16-22 | 10-16 | 90-96 %ile | HUL, Amazon, JP Morgan |
IIFT Delhi | 51-70 | 4-8 | 8-14 | 92-98 %ile | Adani, Britannia, Amazon |
Section | Raw Score Band | Approx Section %ile | Section Cutoff for IIM-A/B | Decision Rule |
|---|---|---|---|---|
VARC | 50+ | 98-100 %ile | 95-99 %ile | Required for IIM-A shortlist |
DILR | 55+ | 97-100 %ile | 93-99 %ile | Major driver for IIM-B shortlists |
QA | 55+ | 96-100 %ile | 92-99 %ile | Pushes NMIMS and SPJIMR calls |
VARC | 35-49 | 85-97 %ile | 80-92 %ile | Target Tier-2 interviews |
DILR | 30-54 | 80-95 %ile | 75-90 %ile | Improve with sectional practice |
QA | 30-54 | 78-94 %ile | 75-90 %ile | Quant boosters recommended |
Use rule Match raw score to Table 1 then find colleges in Table 2 within your percentile band.
Section rule If any section falls below the college's sectional cutoff, your shortlist probability drops significantly.
Profile rule Work experience, academic record, and diversity points can lower cutoff needs by 1-3 %ile for some schools.
Retake rule For a +20 raw-score gain, expect a +3-8 %ile jump depending on band.
Verification rule Always verify cutoffs with official admission data released by colleges in 2026-27.
Sources: Based on placement reports published by top institutes, As per NIRF 2026 bandings, and official admission trends for 2026-27.
Important Data & Statistics (2026)
Direct answer: The 2026 CAT score vs percentile mapping tightened at the top end; a raw score of around 140-150 now typically maps to the 99.5-100 %ile, while the 95-98 %ile band usually corresponds to raw 95-120 marks. Use percentiles for shortlisting and raw scores for sectional target planning.
Overall test-takers: CAT 2026 saw an expected pool of 2.6-2.8 lakh registered candidates, with roughly 2.1-2.4 lakh actual takers (verify with IIMs' official release).
Batch sizes & seats: Top IIMs and peers expanded intake slightly; combined top-10 IIM PGP seats are in the expected range of 4,200-4,500 for 2026-27, while flagship campuses like IIM-A/B/C each report batch sizes around 400-600 (verify by official college admission pages).
Score–Percentile distribution table
Raw Score Range | Expected %ile Band | Notes | Typical colleges in range | Placement avg CTC band |
|---|---|---|---|---|
140-150 | 99.5-100 %ile | Top-performer band | XLRI Jamshedpur, IIM-A | 30-45 LPA |
120-139 | 99-99.4 %ile | Very competitive | IIM-B, IIM-C, FMS | 20-35 LPA |
95-119 | 95-98 %ile | Shortlist-ready for top-20 | SPJIMR, MDI, NMIMS | 12-22 LPA |
70-94 | 85-94 %ile | Strong for top-50 private colleges | IIFT, IMT, mid-tier NIRF 50-100 | 8-15 LPA |
40-69 | 60-84 %ile | Good for regional MBA programmes | Ansal University School of Management | 4-8 LPA |
0-39 | 0-59 %ile | Consider retake or alternative exams | Anurag University MBA Hyderabad | 3-6 LPA |
Year-on-year trend: Based on placement reports and IIM admission notes, the average raw score needed for a top-6 IIM shortlist rose by an expected 3-6 marks in 2026 versus 2025; industry experts suggest increased test difficulty and higher application volumes as causes.
Test-taker trend Expected registered: 2.6-2.8 lakh; actual takers: 2.1-2.4 lakh.
Top percentile density 99+ %ile cluster concentrated in raw scores 120-150.
Sectional impact A difference of 6-8 raw marks in DILR can shift percentile by ~3-5 %ile.
Placement bands Average CTC band for top-10 colleges: 25-35 LPA, median CTC typically 18-22 LPA.
Cutoff bands IIM PGP shortlist cutoffs for general category expected: 99+ %ile for IIM-A/B/C; IIFT and XLRI XAT-equivalent cutoffs in the 98-99 %ile range.
Expert insight: For shortlisting, use percentiles to filter colleges but plan with raw-score scenarios for sectional weaknesses. According to official admission data, institutes weigh diversity, work-ex and academic profile alongside CAT percentile; use a profile-aware shortlist rather than percentile-only rules.
Actionable step: Run your profile through a shortlist tool, compare expected cutoffs, and prioritise colleges where your work-ex or domain skills offset sectional gaps; try the Profile Analyzer and College Shortlister to convert these bands into targeted applications.
Takeaways
Score mapping A raw CAT score of 150-165 often maps to the 99+ %ile band in 2026 (expected, verify with official CAT 2026 normalization).
Sectional impact Section cutoffs (VARC/DILR/QA) matter for IIM shortlists; expect 70-80 %ile sectional bands for top IIM calls in 2026.
Shortlist rule Colleges use percentile not raw scores; aim for 95+ %ile for Tier-2 B-schools and 99+ %ile for IIMs and XLRI.
Work-ex effect 2-5 years of relevant work experience can improve interview chances despite a lower percentile; many institutes adjust weightage during final selection.
Score volatility Normalization can shift a candidate 2-5 raw marks across slots; estimate percentile bands rather than exact conversions.
Frequently Asked Questions
What is the difference between CAT score and CAT percentile?
The CAT score is your raw marks after scaling in each section; the CAT percentile shows how you rank against other test-takers. Percentile compresses scores into a relative position, so a 150 raw may be 99.1 %ile if many candidates scored lower.
How do I estimate my CAT percentile from raw marks?
Estimate by checking slot-wise scaling and historic conversion bands; use expected raw-to-%ile tables published after each CAT slot. For 2026, a rough rule: 140-150 raw often lands 97-99 %ile depending on slot toughness.
What raw CAT score usually maps to 99+ percentile in 2026?
99+ %ile typically requires a raw score between 150 and 165 in 2026, depending on the slot and paper difficulty. Verify with the official CAT 2026 percentile table after the exam for exact conversion.
How do sectional cutoffs affect shortlisting for IIMs and XLRI?
Sectional cutoffs filter candidates before final merit; many IIMs and XLRI expect sectional %ile bands in the 70-90 range for calls. A low sectional %ile can block an otherwise high overall %ile candidate from shortlists.
If I score 85 %ile, which colleges can I realistically target?
With 85 %ile, target Tier-2 private colleges and newer government institutes; aim for shortlists at NMIMS/Symbiosis variant programmes or industry-specific MBA colleges. For Tier-1 IIMs, aim to improve to 95+ %ile.
How are ties broken when two candidates have the same CAT score?
Ties are resolved using sectional performance, then VARC/DILR/QA order or candidate age as a last resort; individual institutes apply their own conversion rules. IIMs typically use a pre-defined tie-breaker sequence in their admission policy.
Does work experience change the way percentiles are interpreted by colleges?
Work experience doesn't change the percentile value but changes its admission impact; many institutes weight experience in final selection, so 2-5 years can offset a slightly lower %ile in shortlisting or final merit. Specific weights vary by institute.
Can I convert a low scaled score into a higher percentile through scaling errors or normalization?
Normalization aims to correct slot differences; while rare scaling errors can occur, official bodies release corrected percentiles. You should plan with expected percentile bands and follow official CAT 2026 updates rather than relying on anomalies.
Conclusion
The CAT score vs percentile relationship matters because colleges use percentiles to compare candidates across different slots and papers; your raw marks are only part of the story. Treat official 2026 percentile tables and slot-wise normalization as final, and plan your target percentiles based on college cutoffs rather than raw scores.
Start refining your shortlist and mock strategy now to close the gap between your expected raw scores and the percentiles colleges require. Use the College Shortlister or Profile Analyzer to test realistic targets and run fee/ROI scenarios before you apply.
About MBA Compass
MBA Compass is an MBA discovery and decision platform built by B School Buzz for Indian aspirants and working professionals. It bundles college data, exam guidance, profile diagnostics, and comparison tools so you can make decisions with data rather than guesswork.
The platform helps you shortlist colleges, assess gaps in your profile, compare programme fees and expected packages, and prepare with full-length mocks and coaching options. Professionals with 2-7 years of experience use it to identify programmes that match their career switch goals and financial constraints.
On the financial side, MBA Compass helps you model fees, expected average CTC bands, and long-term ROI so you understand payback periods and wealth outcomes before you commit. Explore the tools to shortlist colleges, analyse your profile, or run an ROI check.